Academic IELTS Writing Task 1 Graphs
Questions Example

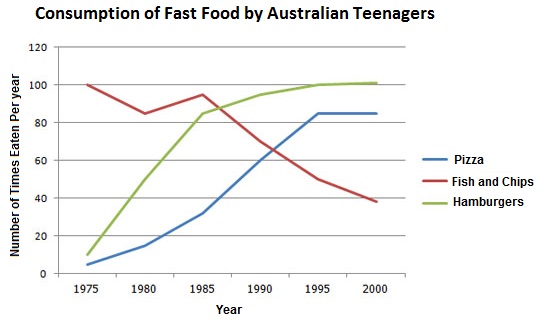
The line graph below shows changes in the amount and type of fast food consumed by Australian teenagers from 1975 to 2000.
Summarize the information by selecting and reporting the main features and make comparisons where relevant.
Example 1
The graph compares the consumption of junk food for teens in Australia over a 25 year period, between 1975 and 2000.Overall, the consumption of fish and chips declined over the provided period, whereas the amount of pizza and hamburgers that were eaten increased.
In 1975, the most popular junk food with Australian adolescents was fish and chips, being eaten 100 times a year. This was far higher than Pizza and hamburgers, which were consumed approximately 5 times a year. However, apart from a brief rise again from 1980 to 1985, the consumption of fish and chips gradually declined over the 25 year timescale to finish at just under 40 in 2000.
In sharp contrast to this, teenagers ate the other two fast foods at much higher levels. Pizza consumption increased gradually until it overtook the consumption of fish and chips in 1990. It then levelled off from 1995 to 2000. The biggest rise was seen in hamburgers as the occasions they were eaten increased sharply throughout the 70’s and 80’s, exceeding that of fish and chips in 1985. It finished at the same level as fish and chips began, with a consumption of 100 times a year.
(198 words)
Example 2
The given line graph depicts the Australian teens’ habit of fast food consumption between 1975 and 2000. It can be seen from the graph that the popularity of hamburgers rose dramatically among the Australian adolescents, whereas the fish and chips gradually decreased.
In 1975, fish and chips was eaten the most by Australia’s youth, for 100 times per year, while Pizza and Hamburgers were only consumed for about 5 and 10 times a year. While the popularity of fish and chips had a small dip in 1985, before reaching again almost 100, hamburgers had increased dramatically until nearly 85 consumptions, almost surpassing fish and chips. From then on it decreased steadily until just under 40 consumptions a year in 2000.
Although, hamburgers and Pizza followed a similar partner of increase, pizza only reached slightly over 80 consumptions 10 years later in 1995. At that time pizza leveled off and its consumption stayed steady until 2000. Hamburgers on the other hand, kept on growing from 1985 until 1995, almost surpassing 100 consumptions a year. After 1995 it only increased slightly to just above 100.
(183 words)
Example 3
The given presentation shows data on the consumption of fast food by Australian Teens from 1975 to 2000. The units are measured in a number of times eaten fast food per annual.
As is observed from the given data, teenagers have chosen to eat fast foods especially in Pizza and Hamburger, which were the most preferred food, in overall, compared to fish/chips. Fish and chips were the most popular food amongst Australian youth at the beginning of the period and then this title gave way to hamburgers by the end of the period.
In 1975 fish and chips were eaten 100 times per year by Australian teens. After a brief decline in 1980, the consumption for fish and chips rose again. Only, from 1985, the consumption for fish and chips decreased at a constant rate to finish at about 40 in 2000.
The consumption of pizza and hamburgers started at a lower level compared to those of fish and chips, with about 9 and 15 times, respectively. After that, the figures for pizza and hamburgers increased rapidly within 20 years. Finally, most of Australian teenagers preferred to eat pizza and hamburgers in 2000, which increased to reach at about 80 and 100 times respectively.
(205 words)
Example 4
The picture shows changes in the number of fast food kinds consumed by Australian teens in the 25 years period between 1975 and 2000. Overall, fish and chips were the only variation of fast food that decreased, while hamburgers and pizza continually increased between 1975 and 2000.
In 1975, fish and chips were the most popular fast food with Australian youth, being eaten 100 times per year, while pizza and hamburgers were consumed fewer than approximately 5 times each year. However, from 1980 to 1985, after having a brief rise again, fish and chips plunged to a low of just under 40 times per year over the 25 years timescale.
By contrast, teenagers ate the other two fast food at much higher levels. The consumption of pizza climbed remarkably until it overtook fish and chips consumption and it then levelled off between 1995 and 2000. The biggest growth among junk food was hamburgers, increasing considerably throughout 1980’s and 1990’s, exceeding fish and chips consumption in 1995. It finished at the same level that fish and chips began, with a consumption of 100 times a year.
(185 words)
Get your writing and speaking corrected
Join the ever growing group of students who we helped on the road to success and get the professional help you have been looking for.


Useful Links
Writing Correction
Have one of our teachers look at your Writing Task and give feedback and correction within 24 Hours
Writing Task 1
Have a look at an overview of Academic IELTS Writing Task 1
Writing Task 1 Tips & Tricks
Have a look at some of the important tips and tricks to get a better score at Academic IELTS Writing Task 1
Writing Task 1 Grammar
Have a look at some of the grammar needed for Academic IELTS Writing Task 1
Writing Task 1 Vocabulary
Have a look at some of the vocabulary needed for the introduction and general overview of Academic IELTS Writing Task 1
Writing Task 1 Graphs
Have a look at how to deal with Graphs, how to analyse, structure, write,…
Writing Task 1 Graphs Examples
Have a look at some of the examples of Academic IELTS Writing Task 1 Graphs and see how other people deal with writing them.
Writing Task 1 Graphs Vocabulary Change
Have a look at some Graph Vocabulary to deal with Dynamic Graphs and Changes.
Writing Task 1 Graphs Vocabulary Numbers
Have a look at some Graph Vocabulary to deal with Graphs and Numbers.
Writing Task 1 Graphs Vocabulary Practice
Have a look at some exercises and practice some of the vocabulary used for Academic IELTS Writing Task 1 Graphs
Writing Task 1 Maps
Have a look at how to deal with Maps, how to analyse, structure, write,…
Writing Task 1 Maps Examples
Have a look at some of the examples of Academic IELTS Writing Task 1 Maps and see how other people deal with writing them.
Writing Task 1 Maps Vocabulary
Have a look at some of the vocabulary used for Academic Writing Task 1 Maps
Writing Task 1 Maps Vocabulary Practice
Have a look at some exercises and practice some of the vocabulary used for Academic IELTS Writing Task 1 Maps
Writing Task 1 Processes
Have a look at how to deal with Processes, how to analyse, structure, write,…
Writing Task 1 Processes Examples
Have a look at some of the examples of Academic IELTS Writing Task 1 Maps and see how other people deal with writing them.
Writing Task 2
Have a look at an overview of IELTS Writing Task 2 and how to deal with it.