
How to Write an IELTS Writing Task 1 Graph Question
As in any task there are different steps to take:
To analyse this more closely, we’ll look at the following example:
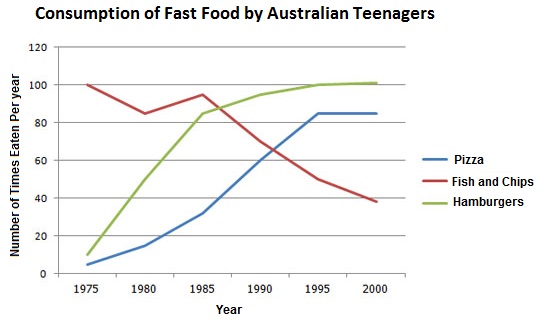
The line graph below shows changes in the amount and type of fast food consumed by Australian teenagers from 1975 to 2000.
Summarize the information by selecting and reporting the main features and make comparisons where relevant.
Write at least 150 words.
Analyse the graph
When analysing/examining the graph, do not spend too much time on it, about 2 minutes max if you are not so good at analysing, or haven’t practiced a lot. With some good practice you should be able to do this under a minute. You only need to write about the obvious things you see at first glance. Going back to the example:
At first glance we can see that:
- Fish and Chips go down
- Pizza and hamburgers go up
Yes there are other minor differences and pizza and hamburger do not go up at the same rate and dates, but generally speaking they follow the same trend. Fish and chips follows to opposite trend and are going down. If you now put these 2 ideas together and compare them you have the second paragraph of the task, the general overview.
If you want to go into more detail, you have reached the 3rd part/body of the task the in-depth analysis.
Putting it all together we get the full model answer:
The graph compares the consumption of junk food for teens in Australia over a 25 year period, between 1975 and 2000.Overall, the consumption of fish and chips declined over provided the period, whereas the amount of pizza and hamburgers that were eaten increased.
In 1975, the most popular junk food with Australian adolescents was fish and chips, being eaten 100 times a year. This was far higher than Pizza and hamburgers, which were consumed approximately 5 times a year. However, apart from a brief rise again from 1980 to 1985, the consumption of fish and chips gradually declined over the 25 year timescale to finish at just under 40 in 2000.
In sharp contrast to this, teenagers ate the other two fast foods at much higher levels. Pizza consumption increased gradually until it overtook the consumption of fish and chips in 1990. It then levelled off from 1995 to 2000. The biggest rise was seen in hamburgers as the occasions they were eaten increased sharply throughout the 70’s and 80’s, exceeding that of fish and chips in 1985. It finished at the same level as fish and chips began, with a consumption of 100 times a year.
(198 words)
Now you have a good idea about how to write an Academic IELTS task 1 graph question, but you might still have some issues with the grammar or the vocabulary. If you need some help with this have a look at our grammar lesson. For vocabulary you can have a look at the general vocabulary or vocabulary to describe changes.If you still need more help have a look at our tips and tricks for Academic writing task 1.
If this doesn’t help you enough, ask us a question in the comments and we’ll help you.