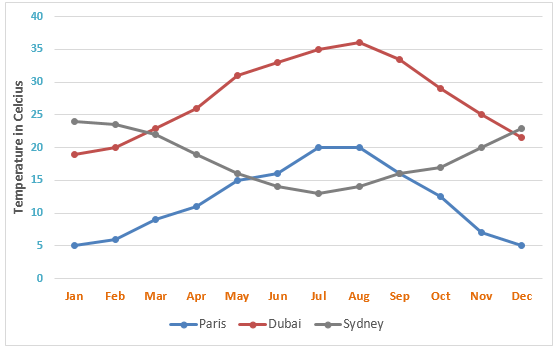
The line graph below shows the average monthly temperatures in three major cities.
The line graph below shows the average monthly temperatures in three major cities.
IELTS is a registered trademark of University of Cambridge, the British Council, and IDP Education Australia. This site and its owners are not affiliated, approved or endorsed by the University of Cambridge ESOL, the British Council, and IDP Education Australia. The information on this site is for information purposes only.
ieltsassistance.co.uk © 2018 All rights reserved.
Can’t find what you need?
Ask our teachers: