Academic Writing Task 1 Graphs Examples
Line Graph example
The line graph the average monthly change in the prices of three metals during 2014
You should spend about 20 minutes on this task.
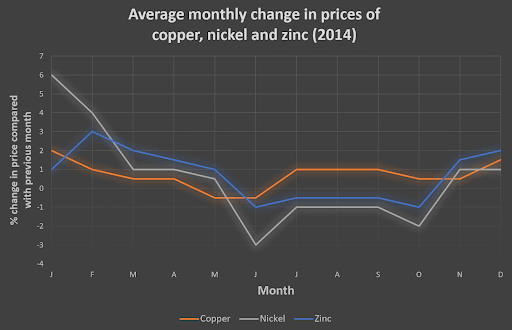
The graph below shows the average monthly change in the prices of three metals during 2014.
Summarise the information by selecting and reporting the main features, and make comparisons where relevant.
Write at least 150 words
Model Example Answer
The line graph depicts the average monthly rise or fall in how much copper, nickel, and zinc cost throughout 2014. Overall, nickel started with the highest percentage change of the three but ended with the lowest. Zinc started with the smallest change and ended with the highest, while copper prices fluctuated. Prices for all three metals dipped in June.
Nickel experienced significant fluctuations throughout the year, with a sharp decline from February to July. In January, the price of nickel was up by 6%, but this dropped to -4% in June, ending the year with a 1% increase in both November and December. Copper began the year with an increase of 2%, and by May, the price was dropping by slightly less than 1%. It rose again, increasing by a percentage point in July, August, and September. Zinc saw its most dramatic increase in February, with a 4% rise, and the price fell in June with a 2% decrease. The change remained negative until October/November when it began to rise.
Send us your writing Writing Task 1 we'll check
Writing Task 2 Essay Model Examples
Get your writing and speaking corrected
Join the ever growing group of students who we helped on the road to success and get the professional help you have been looking for.