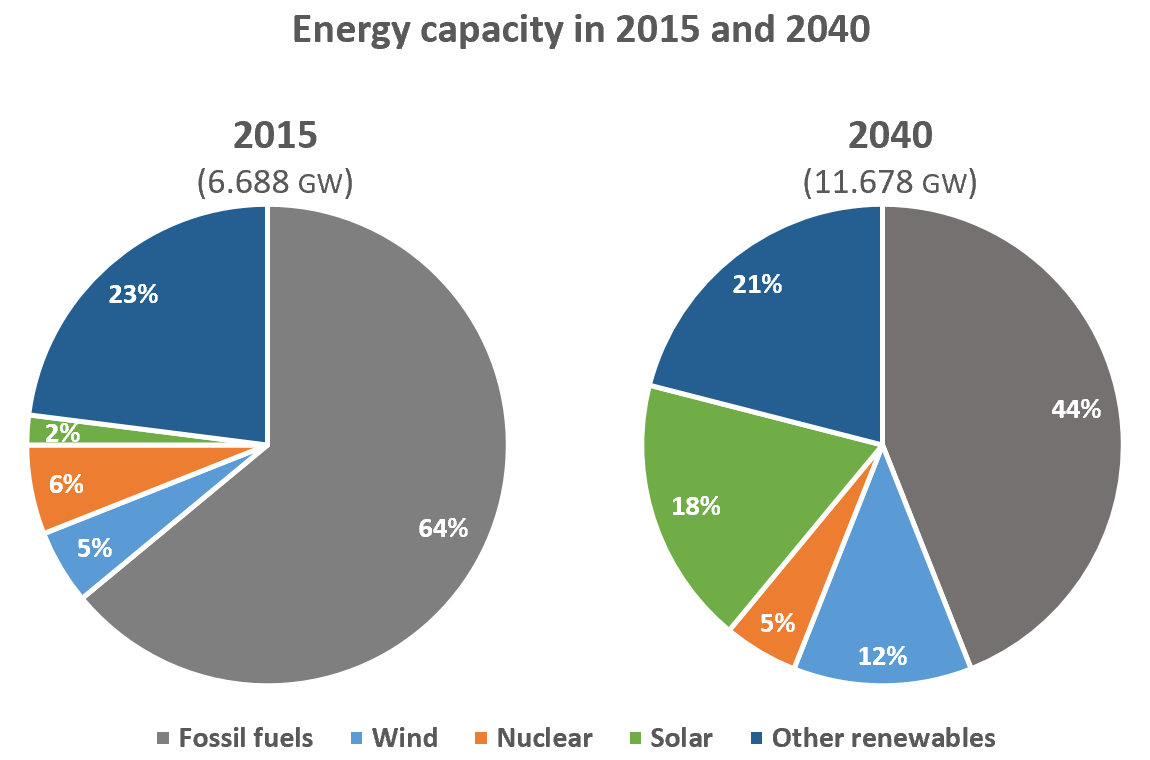
IELTS Writing The pie charts compare the proportion of energy capacity in gigawatts (GW) in 2015 with predictions for 2040
IELTS Writing The pie charts compare the proportion of energy capacity in gigawatts (GW) in 2015 with predictions for 2040
IELTS is a registered trademark of University of Cambridge, the British Council, and IDP Education Australia. This site and its owners are not affiliated, approved or endorsed by the University of Cambridge ESOL, the British Council, and IDP Education Australia. The information on this site is for information purposes only.
ieltsassistance.co.uk © 2018 All rights reserved.
Can’t find what you need?
Ask our teachers: