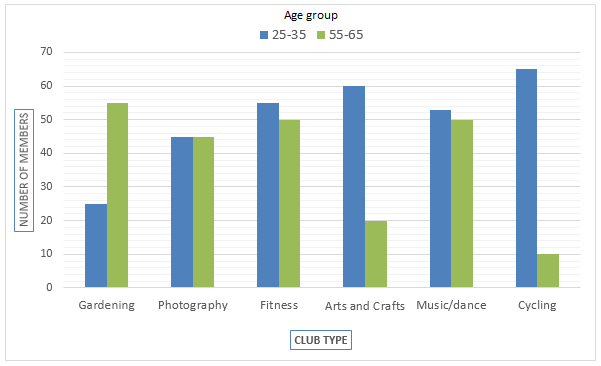
The bar graph below represents the data about the clubs joined by the people of two different age groups at a leisure centre in a small city.
The bar graph below represents the data about the clubs joined by the people of two different age groups at a leisure centre in a small city.